There are a number of tools available for profiling, each with their own strengths and weaknesses. This makes it difficult to recommend one "right" way of analyzing performance using profilers. Instead, one should use a combination of the tools to discover and eliminate performance bottle necks. Common profilers are Charm++ Projections (tracing-based), HPCToolkit (sampling-based, very versatile), Linux perf (sampling-based, command line only), Intel VTune (sampling-based, works well on Intel hardware), AMD uProf (similar to Intel VTune), and Score-P (sampling and tracing, with MPI and pthread interfacing).
Profiling with HPCToolkit
Follow the HPCToolkit installation instructions at hpctoolkit.org. The Spack installation seems to work well. Once installed, compile your executable in Release mode with -D ENABLE_PROFILING=ON -D DEBUG_SYMBOLS=ON since otherwise you won't be able to get call stacks and source analysis. Using -D BUILD_SHARED_LIBS=ON is recommended since it makes HPCToolkit a lot easier to use. You must also use the system allocator, -D MEMORY_ALLOCATOR=SYSTEM. We will work from the build directory and perform all runs and performance analysis there.
First run HPCToolkit as:
We will profile on one core, but you can profile on multiple cores as well as multiple nodes if using MPI as the Charm++ backend. This will generate a hpctoolkit-EXEC-measurements directory. Run
where N is the number of cores to run on. This will generate a mapping to line numbers, etc. in the measurements directory.
- Warning
- Skipping the hpcstruct step will make hprprof below run extremely slowly.
Once the run is complete, run
or if HPCToolkit version < 2024, run
Note that the + is a literal + symbol.
This will create the directory
which you can view using
HPCViewer will generally start you in the Top-down view (callgraph of callers). You can select Bottom-up view (callgraph of callees) to get a different perspective. Whether you want to look at the callgraph of callers or callees depends a bit on the executable, what you're looking to measure, and how you like to think about things. The callees graph can give you a nice overview of what the low-level things taking up a lot of time are, but certainly makes the call stack not look like you would expect. On the right of the callgraphs you will see CYCLES:Sum (I) and CYCLES:Sum (E). I means time spent including callees, while E means time spent in the function itself (exclusive time). Sorting by exclusive gives a good idea of what the hot functions are. Here is a screenshot from HPCViewer:
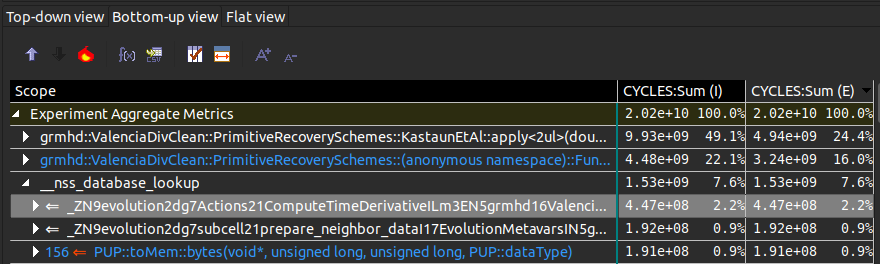
You can see that 49.1% of inclusive time is spent in primitive recovery, and the line after the 49.1% function is a function inside the Kastaun recovery scheme. The __nss_database_lookup is some system call, e.g. __memcpy_avx_unaligned_erms or __memset_avx2_unaligned_erms. Looking at the calling code, e.g. prepare_neighbor_data gives a good hint as to what's going on. In most cases these are memory copies or memory sets (std::vector default initializes its memory, which is bad for performance). The way to fix these bottlenecks is to avoid memory copies and std::vector<double> as buffers.
HPCToolkit allows you to sample on a variety of different event counters instead of just cycles. Please see the HPCToolkit manual for details.
Profiling with AMD uProf
AMD uProf is AMD's sampling-based profiler that makes it relatively easy to do quite a bit of detailed performance analysis. The uProf manual is quite good and extensive, so for the most part the reader is referred to that. However, we will go over some basics for profiling executables and understanding the results. Make sure to compile your executable in Release mode with -DENABLE_PROFILING=ON -D DEBUG_SYMBOLS=ON since otherwise you won't be able to get call stacks and source analysis.
When you open uProf you may be asked to change the kernel event paranoid level. Once you have uProf open, select PROFILE at the top. Specify the application path, options, etc. We will again run on a single core to analyze performance. It's recommended that you set the Core Affinity in AMD uProf so that your application isn't migrated between cores during a profiling run. Then choose Next in the lower right corner. Make sure the CPU Profile Type is set to CPU Profile at the top. We will first do a Time-based Sampling run (on the left). This means uProf will interrupt the application every N milliseconds and see where the application is. You typically want a few thousand total samples to get something that's reasonably representative of your application. Under the Advanced Options make sure Enable CSS (on the right) is enabled (green) and that Enable FPO is also enabled. Now click Start Profile in the bottom right. Once the profile is complete you will be presented with a summary outlining where your code is spending most of its time. Click ANALYZE at the top to get a more detailed view. On the left you can select between a callgraph of callees (Function HotSpots), a callgraph of callers (Call Graph), and a few other views. Below is an example of a result from the same run we used with HPCToolkit above.
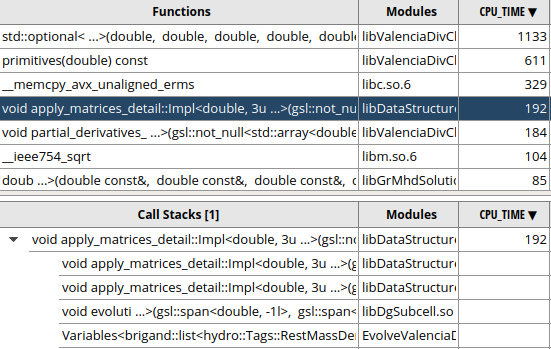
Again we see that most of our time is spent in primitive recovery but also that a lot of time is spent copying memory. This was grouped into __nss_database_lookup in HPCToolkit. Unfortunately, getting a call stack out of the memcpy doesn't always work and so while you know you're spending a lot of time copying memory, it's not so obvious where those copies are occurring.
Profiling With Charm++ Projections
To view trace data after a profiling run you must download Charm++'s Projections software from their website. If you encounter issues it may be necessary to clone the git repository and build the correct version from scratch. Note that the version of Charm++ used to compile SpECTRE should match the version of Projections used to analyze the trace data. You can collect the trace data on a different machine than the one you will be analyzing the data on. For example, you can collect the data on a supercomputer and analyze it on your desktop or laptop.
For profiling you will want to use a production build of Charm++, which means compiling Charm++ with the --with-production flag. To enable trace collecting you must build with the --enable-tracing flag as well. For example, on a multicore 64-bit Linux machine the build command would be
You must build your executable in Release mode as well, specifying -DCMAKE_BUILD_TYPE=Release to CMake, as well as
to enable SpECTRE to use Charm++'s tracing features.
Running SpECTRE With Trace Output
When running SpECTRE you must specify a directory to output trace data into. This is done by adding the command line argument +traceroot DIR where DIR is the directory to dump the trace data into. Note that DIR must already exist, the application will not create it. For example,
You might get a warning that Charm++ had to flush the log some number of times during the run. Flushing the log adds overhead to the execution and so affects timing measurements. While Charm++ has the ability to manually flush the log periodically (and therefore exclude the time it takes to flush the log from the trace), we have not yet implemented support for this. For short executable runs you can increase the log size by specifying +logsize M when running the executable. The default log size is 1,000,000 (1000000). Note that if you increase the log size too much you will run out of memory/RAM.
For more information on runtime options to control trace data see the Charm++ Projections manual.
Visualizing Trace Data In Projections
By default Charm++ records entry method names by using the PRETTY_FUNCTION macro. This means entry method names include all class (parallel component) and action template parameter names, including any template parameters of the template parameters. This very quickly leads to incomprehensibly long names that are very difficult to read in the Projections interface. We include a basic Python executable to handle the majority of renames, but the executable supports additional basic (textual find-replace) and regular expression replacements via a JSON file. These additional replacements are useful for making executable-specific renames. The Python executable is tools/CharmSimplifyTraces.py and an example replacements file is tools/CharmTraceReplacements.json.
See the Charm++ Projections manual for details.
Profiling with Score-P
See the Score-P website for installation instructions specific to Score-P.
To compile SpECTRE with Score-P you must invoke CMake with the environment variable SCOREP_WRAPPER=off (do NOT export this variable!) and the scorep- compiler wrappers. For example,
where $SPECTRE_HOME points to your spectre source tree. You can then compile the executable you want to profile. When running the executable you will need to make sure Score-P has enough memory to be able to function properly. For the EvolveGhSingleBlackHole, Score-P needs 1.5GB of memory. To enable profiling, disable tracing, and use 1.5GB of memory for Score-P, set the environment variables
We also need to use a filter file to keep the data at all manageable and to avoid some currently not understood interaction between Score-P and our option parser. The profile is in support/Profiling/ScoreP and named spectre.flt. The final command should look something like:
Depending on your profile, you might also need to increase the callpath depth by setting
Once you've successfully run the executable you should have a directory like scorep-20251006_1732_65976792745157592. Please see the Score-P documentation for how to analyze the output.