This tutorial shows you how to load 3D volume data in Python and visualize it using matplotlib.
First, you need access to the spectre Python bindings. A simple way to do this is to run a Jupyter server from the build directory:
You can find detailed instruction in the tutorial on Using SpECTRE's Python modules.
Note for VSCode users: You can also select this Jupyter server as kernel for notebooks running in VSCode (see docs).
Now we can import modules from the spectre Python package.
Select an observation
First, we open the H5 volume data files from a simulation and get a list of all available observations and their times:
We can also list all available variables in the volume data files:
ConformalFactor                 ExtrinsicCurvature_xx           ExtrinsicCurvature_yx
ExtrinsicCurvature_yy           ExtrinsicCurvature_zx           ExtrinsicCurvature_zy
ExtrinsicCurvature_zz           InertialCoordinates_x           InertialCoordinates_y
InertialCoordinates_z           Lapse                           RadiallyCompressedCoordinates_x
RadiallyCompressedCoordinates_y RadiallyCompressedCoordinates_z ShiftExcess_x
ShiftExcess_y                   ShiftExcess_z                   Shift_x
Shift_y                         Shift_z                         SpatialMetric_xx
SpatialMetric_yx                SpatialMetric_yy                SpatialMetric_zx
SpatialMetric_zy                SpatialMetric_zz
Interpolate to a slice
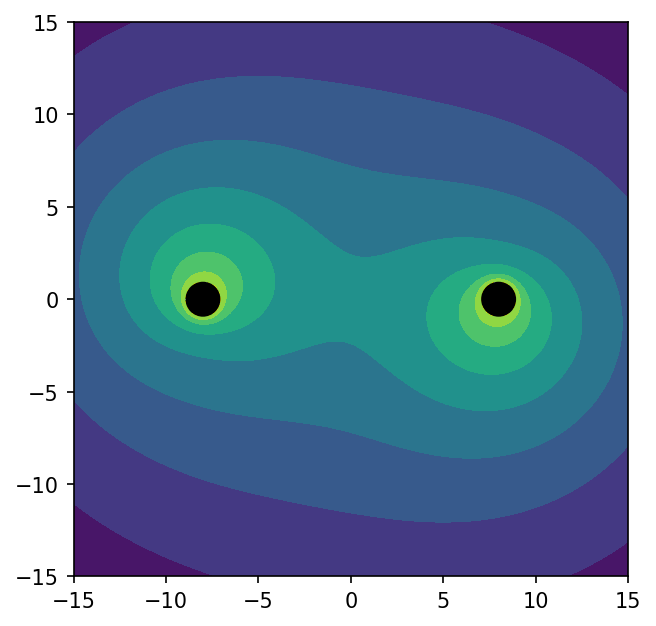
One way of visualizing your 3D volume data in a 2D plot is with a slice. Use interpolate_to_points to interpolate your volume data to any set of coordinates:
Now we can plot the 2D slice with matplotlib:
/var/folders/xp/5t2ny359187c4ljckf8sz3m80000gn/T/ipykernel_19858/3375439396.py:2: RuntimeWarning: invalid value encountered in subtract
  plt.contourf(x, y, np.log(1 - lapse))
Plot individual elements
You can also iterate over elements in your volume data to plot things like element boundaries, collocation points, etc. Use iter_elements:

Transforming volume data
Often you want to post-process volume data to compute derived quantities from the ones the simulation has written out. You can sometimes do this within tools like ParaView (e.g. using ParaView's "Calculator" filter) if the computation is simple enough and pointwise (i.e., needs no derivatives or other mesh information). If you can't get what you need in ParaView, you can use spectre transform-vol. It takes any Python function (a "kernel"), runs it over your volume data, and writes the result back into the files.
For example, let's add the number of grid points in each element as a field that we can visualize:
You will be prompted to select an output dataset name (hit enter to select the default "Extents"). The result will be written back into the H5 files. If you now regenerate an XDMF file for the volume data you will be able to see the output in ParaView.
The transform-vol tool supports arbitrary Python functions as kernels. Many Python functions from the spectre module are useful kernels. For example, here are some useful kernels:
- p-refinement (number of grid points per dimension): spectre.Spectral.Mesh3D:extents
- Relative/absolute truncation error (from power monitors): spectre.NumericalAlgorithms.LinearOperators:relative_truncation_error or absolute_truncation_error
- Coordinates in different frames: Element:grid_coordinates or Element:distorted_coordinates
You can find more useful kernels by browsing the spectre.PointwiseFunctions module: https://spectre-code.org/py/_autosummary/spectre.PointwiseFunctions.html
You can also write your own kernels. Create a Python file, e.g. kernel.py, and write a function like this:
Now you can run this kernel over your volume data like this:
You can find more details by running spectre transform-vol --help.